team payroll calculation detail
the previous study carried out by this page used primarily data from the comprehensive lahman database, which contains player salary data going back to 1985. one of the flaws of this use of the database, as was noted in the study, is the systemic underreporting of total team salary by the amount of players who did not contribute to the team's on-field performance. in 2005 for the cubs, this excluded notably one sammy sosa, some $12mm of whose contract was paid by the chicago cubs as a condition of his trade to baltimore. it also excluded, as it does with every team, every member of the 40-man roster and the disabled lists -- all of whom count against the luxury cap -- who did not play in 2005.
however, this understates the inaccuracy of the lahman database's computation, as players who were members of another team (as of opening day) also have their records excluded from an empirical query of cub players for that year -- that is, for example, aramis ramirez and kenny lofton, who were acquired in mid-2003, have records in the database affiliating them only with the pittsburgh pirates in that year and so don't compile into the total payroll outlay for the cubs in that year.
in 2005, the sole example this on the major league level was matt lawton -- but, on the minor league level, excluded also all callups, mid-season signees and moves off the 60-day disabled list. in total, these players were (alphabetically) cedeno, fontenot, greenberg (hope that bump on the noggin has cleared up), grieve, hill, koronka, mcclain, mitre, murton, novoa, ohman, soto, theriot, van buren, williamson and the great enrique wilson.
further, just as these later additions are not counted toward payroll, players who are divested in the course of the year -- for the 2005 cubs, this includes latroy hawkins, todd hollandsworth and joe borowski -- have their entire 2005 salary attributed to the cub payroll.
now, clearly, very few of these players make truly significant amounts of money -- and, because the nature of the error is systemic, not overwheming in comparison to overall team salary and spread across all teams evenly, the error is relatively safe to ignore within the confines of a framework of estimations in comparative studies between teams such as this page engaged in last week and that of dan agonistes. but -- to be clear -- the lahman database compilations that these studies are based upon are really including players that were part of the club as of opening day, and as such are relevant less to the final payroll expenditures of teams looking backward from the end of the year than to the expected payroll expenditures of teams going into the year looking forward. in order to compare apples to apples, it's important to note that these studies are most valid as a basis of comparison at the very beginning of the year. as it happens, this is exactly that time.
2006 cubs normalized payroll
therefore, this page now intends to examine where the cubs of mid-february 2006 fall into the dataset of recent years with respect to payroll. first, let us cite the previous data:
year - payroll - normal - win% - eff
1998 - $50.8mm - 1.193 - .552 - .463
1999 - $62.3mm - 1.252 - .414 - .330
2000 - $60.5mm - 1.090 - .401 - .368
2001 - $64.7mm - 0.990 - .543 - .549
2002 - $64.7mm - 1.122 - .414 - .369
2003 - $79.8mm - 1.126 - .543 - .482
2004 - $90.5mm - 1.312 - .549 - .419
2005 - $87.0mm - 1.193 - .487 - .409
... noting that the 2005 figure does not include the $12mm allocated to the sosa trade. it's arguable, of course, whether or not sosa's allocation should be included in these figures -- the inclusion would raise 2005 payroll outlay to $99.0mm, normalized at 1.35 -- but, as the purpose of this study is to evaluate the team to be put on the field on april 3, the best basis for comparison remains without.
this writer participated recently in a thread of commentary at bcb the result of which was to approximate the current cub payroll outlay at some $93.2mm. this result was computed using the data at the top of the page, which this writer considers to be materially correct estimates. this would represent a 7.1% increase in the on-field payroll of the club as opposed to last season (while also being a 5.8% cut when considering the sosa allocation).
but how does this normalize to the field -- that is, what percentage of the average major league team's opening day payroll in 2006 will this represent? this question can only be answered in estimation, of course, as this page hasn't access to the expected payroll allocations of all thirty teams. however, we can view the growth rate of average major league team payrolls over the last several seasons to get an estimate on expected growth.
year - mean pay - % yoy
2005 - 72957113 - 5.7%
2004 - 69022198 - (2.7%)
2003 - 70942070 - 5.1%
2002 - 67469250 - 3.2%
2001 - 65355443 - 17.7%
2000 - 55537836 - 11.5%
1999 - 49807625 - 16.9%
1998 - 42609429
over the entire seven year sample period, the average payroll growth rate has been almost exactly 8%. however, with the onset of national economic recession in 2001, payroll allocation growth clearly also slowed, posting an average annualized growth rate of 2.8% over the last four years. 2005 was a year of reasonable economic growth, but in the interests of making a conservative estimate, this page is content to split the different and call for an estimated average payroll growth rate of 5.5%. applied to last year's average opening day payroll figure, this results in an expected 2006 average opening day payroll of $76.97mm.
it is then straightforward to deduce the normalized expected payroll of the 2006 cubs as currently constituted as 1.21 -- that is, 21% greater than the average major league payroll.
as previous studies have indicated, this fits into a chart of average normalized payrolls for levels of achievement thus:
average normalized payroll of 14 wildcard teams ------- 1.17
2006 cubs (estimated) --------------------------------- 1.21
average normalized payroll of 43 division winners ----- 1.29
average normalized payroll of 12 pennant winners ------ 1.42
average normalized payroll of 6 world series winners -- 1.31
this is clearly shy of the kind of spending that one would expect of a team constructed to win its division, league or indeed the world series.
efficiency and winning percentage
this study has not yet made any note of the cubs longstanding trend under the guidance of team president andy macfail to be a relatively inefficient spender of that payroll which they do allocate -- this page would, for example, cite the ridiculous signing of jacque jones for three years and $16mm as an example of such inefficiency in practice. over the last three seasons, the cubs have ranked among all major league teams 17th, 23rd and 24th in payroll efficiency (that is, winning percentage divided by normalized payroll), declining in each successive year of general manager jim hendry's tenure.
should the cubs this year manage to rise to their average payroll efficiency of the last three seasons (.437) with the normalized payroll we have calculated, one should expect the 2006 cubs to post a winning percentage of .528 -- that is, an 85-77 record. however, should they manage the average efficiency of the last eight years (.423), the expectation drops to 83 wins. and if they merely replicate the efficiency of last season (.409), the expectation should be of a record of 80-82 (.495 winning percentage). never mind any falloff -- though such an event is quite plausible, it is also too frustrating to contemplate.
it is generally true (with exceptions) that the most efficient users of payroll tend to be the smallest spenders -- and this makes some sense, operating under the principle that a team is going to win something like a third of its games regardless of how little payroll it allocates, presenting an asymptotic minimum to winning percentage. so it is rational, then, to look at how teams of a normalized payroll of approximately 1.21 have fared in terms of efficiency in recent years, in order to provide a guide as to how efficiency generally fares around this level of normalized payroll. the best examples are, of course, those of the cubs themselves:
year - payroll - normal - win% - eff
1998 - $50.8mm - 1.193 - .552 - .463
1999 - $62.3mm - 1.252 - .414 - .330
2005 - $87.0mm - 1.193 - .487 - .409
... to which we can add the less relevant (because of managerial and other situational differences) but perhaps still useful examples of other squads in the last eight seasons:
year - team - normal - win% - eff
2005 - sfo - 1.236 - .463 - .374
2005 - sea - 1.203 - .426 - .354
2005 - atl - 1.185 - .556 - .469
2004 - stl - 1.206 - .648 - .538
2004 - sfo - 1.188 - .561 - .472
2004 - sea - 1.181 - .389 - .329
2003 - sea - 1.226 - .574 - .468
2003 - stl - 1.181 - .524 - .444
2002 - sea - 1.190 - .574 - .482
2001 - stl - 1.202 - .574 - .478
2001 - tor - 1.177 - .493 - .420
1998 - nym - 1.222 - .543 - .444
1998 - tor - 1.206 - .540 - .448
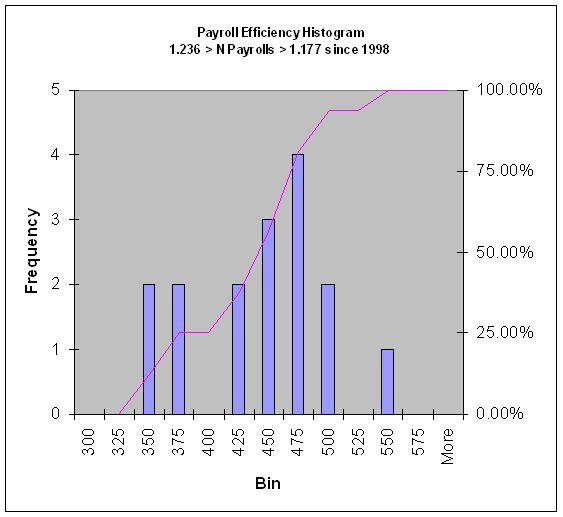
... to say that, while the average cubs squad of the last eight years with a similar normalized payroll to that which this page would expect for 2006 has posted an efficiency of .401 -- translating into an expected 79-83 -- the average efficiency to be expected over all sixteen samples here under consideration is a somewhat better .432 -- again, 85-77. notably, of these sixteen records, only four (those in boldface) entered their league playoffs at any level, with just one advancing beyond the first round.
conclusion
what, then, can we say about the 2006 payroll of the chicago cubs at the outset of the year -- and what inferences can we make from it in forecasting a reasonable expectation of outcome?
it seems to this page that the payroll outlay, being approximately $93.2mm at the beginning of this season, is an indicator of an approximate expected win total somewhere between 79 and 85 -- with perhaps a one-in-four (25%) chance of making the national league playoffs in some respect and a one-in-sixteen (6%) chance of winning the pennant -- offset by a three-in-sixteen (19%) probability of a 90-loss season.
one might note that a one-in-four chance at the playoffs and a one-in-sixteen probability of the pennant are exactly what one would expect if, in a communistic thought experiment, all sixteen teams of the national league were given exactly the same payroll allowance to expend at the beginning of the year. this is to say that, despite possessing considerable economic advantages over virtually every other ballclub in the league, these have been turned to no advantage in on-field expectation whatsoever. this is further confirmed by noting that, in any given year, somewhere between three and five of the 16 national league ballclubs will accrue 90 losses -- comparing very similarly with the 2006 cubs expected probability of descending to that same plateau of futility.
this can only be construed, in the eyes of this writer, as a failure of ownership and management to address on-field success as a meaningful goal. the 2006 cubs look to be, on the basis of this analysis, a quintessentially average ballclub. given the economic advantages of the team, that painful mediocrity can be read in no other way than as an indictment of jim hendry, andy macfail and the tribune company.
part 1: payroll and expectation
part 2: the outfield
part 3: relief pitching
part 4: the infield
part 5: starting pitching
No comments:
Post a Comment